This article originally appeared in InDesign Magazine Issue 69. Subscribe now for the best InDesign content on the planet!
When you want to make a graphical timeline, there’s one tool in InDesign you should reach for immediately: tables.
Earlier in my career, I spent many years making textbooks. Often these textbooks would include graphical timelines with important dates, images, and other content arranged in a precise linear fashion to give students a sense of the timing and context of important events.
But timelines aren’t just for textbooks. You might use timelines in posters, brochures, web graphics, magazine articles, even evidence exhibits for a court case. They’re the perfect kind of infographic for any time you need to portray a sequence of events. You can make them horizontal, vertical, or even in a grid format. Plus you can save a lot of time (and have a lot more fun crafting the look) when you let InDesign handle the chore of making an accurate and flexible structure for the timeline.
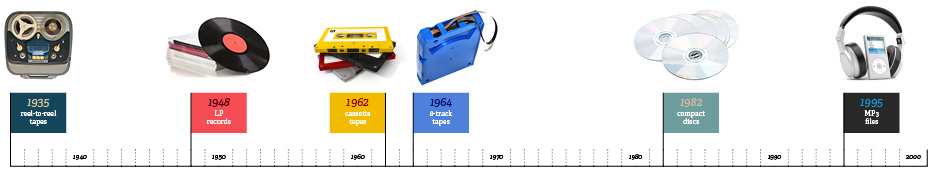
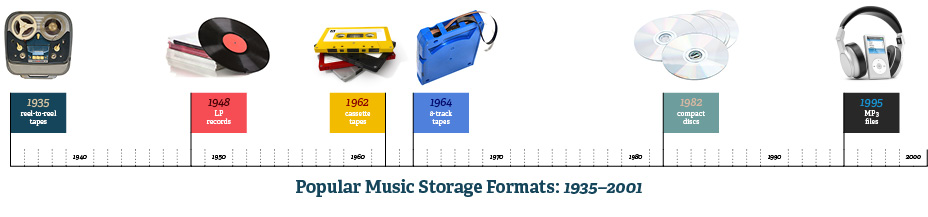
Here is an example of a simple horizontal linear timeline, featuring milestones in the history of audio storage technology from 1935 to 2001.

Building and editing this kind of graphic with any kind of precision would be a time-consuming pain in the neck if you tried to use separate frames and lines for everything. So instead, let’s start with a table.
1. Create the basic table
Start by creating a text frame large enough to contain the entire area of the timeline. Then add a table (Table > Insert Table) with one column for each year, minus one. In this case we want to show 67 years, so we’ll use 66 columns (66 columns make a total of 67 vertical strokes, for the year tick marks in the table).
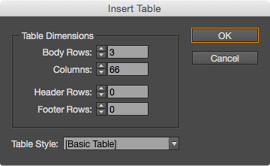
The number of rows depends on the design of the table and how much information you need to put into it. This design is very simple, so we need only three rows: one to contain the events, one for the vertical lines to connect the events to the timeline, and one for the labels and tick marks.
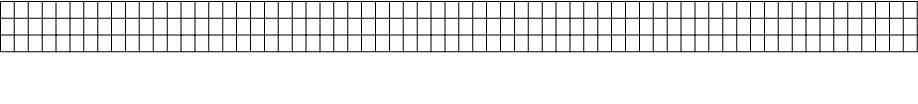
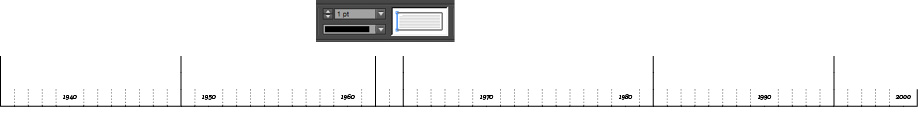
2. Create the tick marks
Select the top two rows, and remove all strokes to create tick marks at the bottom.
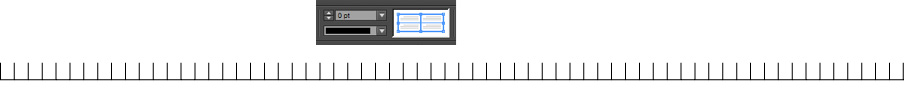
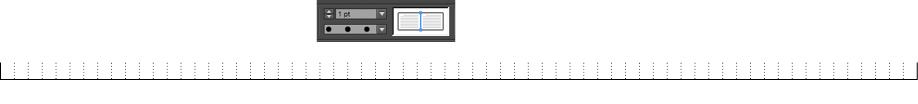
3. Format the tick marks
Select the bottom row, target the internal vertical strokes, and change the stroke style
to dotted.
4. Merge cells for labels
Create the label cells by counting tick marks to find the vertical line which corresponds the year you wish to label. In this design, each decade is labeled, and the labels are centered on the year-line, so we need to merge the two adjacent cells by selecting them and clicking the Merge Cells button in the Control panel.

Tip: If you would rather put the labels below the timeline and show every year with a tick mark, you can add a row to the bottom of the table, put the labels there, and leave the third row’s cells unmerged.
5. Add the labels
Enter the text for the labels, and format it. Be sure to create and use a paragraph style to make your life easier both when applying and tweaking the text formatting.

6. Create the connector lines
For each year where you want to add an event, select the column to the right, and change the stroke style to solid 1-pt black.
7. Merge cells for events
For each event, select a range of cells in the top row adjacent to the solid vertical lines, and merge the cells. The number of cells you’ll need to merge will depend on the amount of information in each event and the text formatting you want to use. In this case, I merged four cells. Occasionally you may need to merge cells to the left of a vertical line when two events are close together, like in this timeline where there are events in both 1962 and 1964.

8. Add the event content
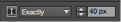
Add the information and graphics for each event. Select the top row, and adjust the height to accommodate the text. In this case, I made the height of the top row exactly 40 px.
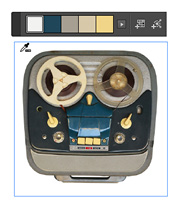
To format the text and cells, I used the Color Theme tool to sample colors from each photo and apply them to the event cells and text.
The photos are placed independently on the page, outside the table. Group them with the text frame if you’re worried they might accidentally get moved out of alignment.
9. Add a title
If you want to add a title to your timeline, select the bottom row, and choose Table > Insert > Row. Insert one row below. Select the whole row, and merge all the cells. Then enter and format your table title. Voilà! You have a nifty horizontal timeline.
From here, you can experiment with different looks by changing the formatting of the tick marks, connector lines, and event cells. Or try creating a vertical version of the timeline table with 3 columns and 66 rows.
Now that you know this cool use for tables, I hope you have fun creating great graphics in a most “timely” manner.


